

How you structure an agent context decides whether each turn bills at 10% or full price
A request ships four segments of context, and the cache only eats contiguous bytes from the head. What each segment is, why order is cost, and the three things we changed: 149 tools down to 20 resident, a byte-stable system block, and three readings that tell you where a collapse came from. With 509 measured runs.
 9 min readCache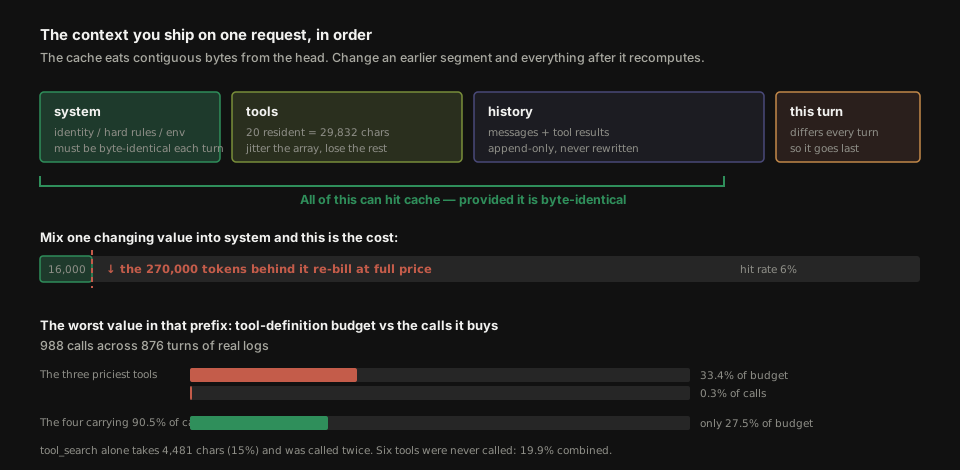
The context you ship on every request is four segments: system, tools, history, and finally this turn's user message.
The cache eats contiguous bytes from the head. It doesn't understand meaning — it compares bytes. Change anything in an earlier segment and everything after it is recomputed. So how you order these four decides whether a turn bills at 10% or full price.
There isn't much room for creativity in the ordering. The rule is one line: most stable first, most volatile last.
Identity, hard rules, and environment notes go at the very front — they shouldn't change a character for the whole session. Tool definitions follow, since they shouldn't change within a turn either. Then history and tool results, which may only be appended to, never rewritten. Last is this turn's user message: it differs every turn, so it belongs at the very end, leaving everything before it untouched.
Here's what we did to each of the first three.
1. Tool definitions: 149 down to 20 resident
Tool definitions are the part people forget. They don't visibly grow the way history does, but they ship in full every single turn.
We audited this against real logs: 5,307 tool-trace entries, 718 request payloads, 988 calls across 876 turns. The result was 20 resident tools per request, 29,832 characters.
The ugly part is what that budget bought:
- The three most expensive tools ate 33.4% of the budget and returned 0.3% of the calls
tool_searchalone took 4,481 characters (15%) and was called twice in the entire sample- 6 tools were never called at all — 19.9% combined
- Meanwhile the four workhorse tools carried 90.5% of calls on 27.5% of the budget
So we tiered them: of 149 tools only 20 stay resident, the rest aren't shipped until they're needed. The point isn't saving characters — it's making that prefix segment small and stable. The smaller the resident set, the higher the odds it comes out byte-identical every turn.
A side finding: readfile shipped 24 parameters and 22 were never used, accounting for 35.3% of its definition. The aliases say even more — file_path vs path split 51.1% : 48.9%, essentially a coin flip. That's not the model choosing, that's the model guessing. Synonym parameters are fossils of "the model guessed wrong so we caved." The fix is a clearer description, not another alias.
2. The system block: every byte has to be nailed down
This is the frontmost segment, which means once it changes, everything behind it is gone.
We only took this seriously after getting burned. The system block had this line — I added it myself, thinking it was helpful to let the agent know whether the workspace was dirty:
- Git branch: master (dirty)It cost 341 low-hit turns and 18.2M tokens in one day.
collectGitInfo() re-queries every time its 30s TTL expires. This workspace has 10,089 files, git status --porcelain occasionally blew past the 1s timeout, and catch set the state to unknown — so the line changed. The 270K tokens behind it went with it, leaving the ~16,000 in front. 6%. The next turn reused the cached value inside the TTL, the line flipped back to dirty, and it hit the older version still sitting upstream. 99.8%. Break, recover, break, recover, with a period exactly equal to the TTL.
The timeout is only the random half. The deterministic half is harder to dodge: the first time an agent edits a file in any session, clean→dirty, that line has to change once. Even if git never times out, every session is guaranteed one break. We'd hit this on 07-17, decided one break per session wasn't much, tagged it P2 and moved on. In long sessions it's P0.
Three parts to the fix, and you need all three:
| Change | Why it isn't enough alone | |
|---|---|---|
| ① | Keep dirty/clean out of the prompt entirely | A timeout still swaps the line to unknown |
| ② | On failure reuse the last good value; a timeout may never rewrite the prompt | The first file edit still breaks it |
| ③ | TTL 30s → 5min | Just lowers frequency; it still breaks |
If the agent wants git state, let it call git status. That's a tool call — it doesn't enter the prefix.
The invariant is pinned now by systemPromptStability.test.ts: after clean→dirty the environment block must be byte-identical, must not contain dirty|clean|unknown, no minute-level timestamps or pids, day-level dates are fine. Nobody remembers this kind of bug. Next time someone drops a "helpful" dynamic field into system, the test catches it.
Worth auditing in your own: timestamps (especially to the minute), pids, random ids, current todos, session memory, skill suggestions, anything describing "current state." Either keep them out of system entirely or attach them at the tail of the messages.
3. Telling where a collapse came from
With the first two done, the remaining question is: the hit rate dropped — whose fault is it?
The easiest way to waste a day here is to see a drop and immediately start rearranging your prompt. Three readings narrow it down first:
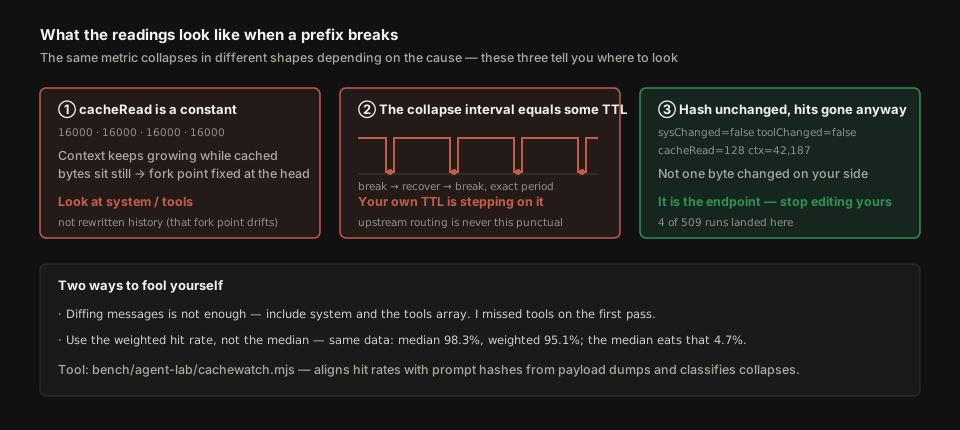
Start with cacheRead. If it's a constant — context climbing while it sits unmoved at some number — the fork point is fixed at the head, so it's system or tools. If instead the fork point drifts later each turn, history is being rewritten.
Then the collapse interval. If it's precisely some number, go find which TTL in your own code equals it. Upstream routing is never that punctual.
Third, check whether high hits appear between collapses. If they do, the prefix wasn't permanently rewritten — it's flip-flopping between two versions, usually some TTL'd value going back and forth.
Two readings that will fool you. Diffing messages isn't enough; you need system and the tools array in there too — I missed tools on the first pass and burned a round. And don't read the median, read weighted — the next section is exactly why.
After the fix: 509 measured runs
With all three done we ran 10.5 hours straight, one record per request, 509 total.
Weighted hit rate 95.1%: 18,356,873 of 19,304,938 context tokens hit. The median says 98.3%. Where's the gap? The median swallows 24 collapses whole — and the cost lives entirely in those collapses, since one miss re-bills the whole prefix at full price. Read weighted.
Those 24 under 50% (4.7%) have something more interesting about them: every one has sysChanged=false and toolChanged=false. We didn't touch a byte. Four of them:
hitRate=0.3  cacheRead=128   ctx=42,187  sysChanged=false
hitRate=0.4  cacheRead=192   ctx=49,869  sysChanged=false
hitRate=0.5  cacheRead=128   ctx=24,923  sysChanged=false
hitRate=32.4 cacheRead=7,168 ctx=22,144  sysChanged=false
A 42K-token context hitting 128 bytes, with a prompt hash identical to the previous turn. That kind of collapse isn't on our side — it's at the endpoint.
Probably the biggest time-saver in this post: when the hit rate drops, check whether the hash moved first. If it didn't, it isn't yours, and editing it is wasted work.
What this is worth
At Anthropic-style pricing, order of magnitude (check your invoice): cache read is about 10% of normal input, cache write costs a bit more, a miss re-bills at full price.
So hit rate isn't a linear cost curve. In that 6% turn all 270K tokens were re-billed at full price; the 99.8% turn was nearly free. Same work, an order of magnitude apart, and the only difference is whether one line of text in the system block changed.
Agents feel this more than anything else. In one-shot chat the hit rate barely registers, but an agent piles tool results on top of each other and the context grows every minute — at which point the cache isn't a small saving, it's whether a long session stays payable at all.
How the three protocols wire up (who pins breakpoints, who auto-hashes prefixes, who uses a side API) is its own post. Keeping the same file out of your context five times over is in the ReadLedger post.
The tool is bench/agent-lab/cachewatch.mjs — it lines up hit rates against prompt hashes from payload dumps by timestamp and classifies collapses on the spot. Every number above came out of it and the tool audit logs.