

Two sub-agents with the same name, one running 20 minutes with zero tool calls: eight root causes
A sub-agent ran 20 minutes with zero tool calls; eight problems were behind it.
 9 min readEngineering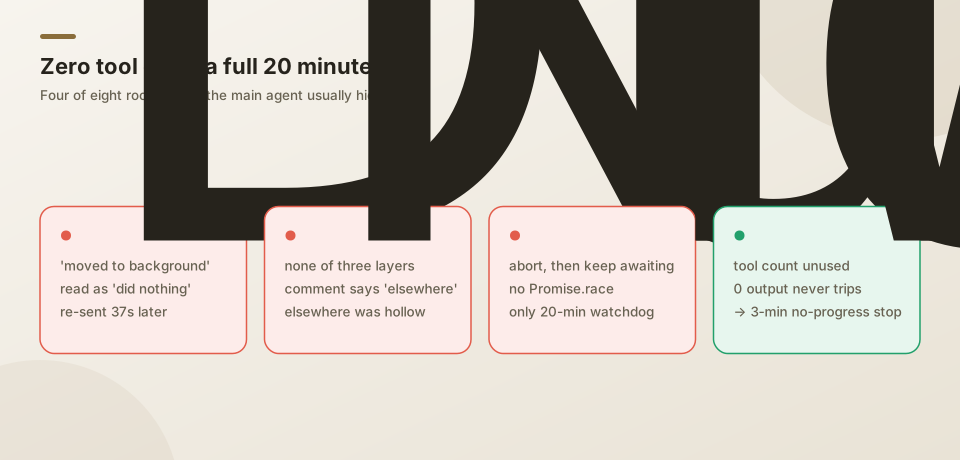
On July 18 we were running a comparative benchmark: a refactoring task in a pet-raising project. Midway, the UI showed two sub-sessions with exactly the same name, "refactor pet growth". One ran a full 20 minutes with zero tool calls before a hard timeout killed it.
The score wasn't affected — the main agent finished the job itself. But it was worth digging, because it showed a lot was broken in the sub-agent layer, normally papered over by the main agent.
The scene
The stall log for that CLI run: 5 concurrent runs, 9 in-flight requests older than 20 seconds; one model request still pending after 719 seconds; several agent tool calls pending for two to three hundred seconds.
The sub-agent dispatch timeline:
| Time | ID | Task | Outcome |
|---|---|---|---|
| 02:09:05 | Agent-1 | Read through the pet system | — |
| 02:15:00 | Agent-2 | Pet growth refactor | Moved to background |
| 02:15:37 | Agent-3 | Carry out growth refactor | Aborted after 480s |
| 02:19:36 | Agent-4 | Fill in intimacy validation | Moved to background |
| 02:20:11 | Agent-5 | Implement intimacy field | Same |
Agent-3's prompt began "implement it directly in this repo, don't just give a plan". The main agent had read "moved to background" as "the sub-agent only gave a plan and didn't do anything", and pushed for a re-dispatch. It happened twice, 37 and 35 seconds apart.
Eight root causes
1. Going to the background returned a status, not a result. When a sub-agent didn't finish within a threshold it was moved to the background, and the main agent got only "moved to background automatically; you'll be notified when it's done". No result, no way to wait, no "don't dispatch this again". And the threshold was a parameter the model itself passed. The rational response was to dispatch another.
2. No task-level deduplication at any of three layers. Same-round batch execution split only into parallel and serial, with no dedup; the parallel-safe table explicitly listed agent, so two identical calls ran simultaneously; registration only checked whether the ID collided, not the task description. The dedup module's comment said "same-round dedup is handled by the parallel executor" — but that executor had long since been hollowed out into a types-only file. Nobody actually owned that responsibility.
A bug rode along: on an ID collision the new task was renamed Agent-1#2, #3, but later completion callbacks still used the original ID, so they landed on the first task and #3 stayed "running" until the 20-minute watchdog killed it. Session titles took the first 40 characters of the description; same description, two identical names.
3. Short timeouts silently didn't work. Every sub-agent type had a 3–8 minute max runtime. But the timeout aborted a signal and then kept awaiting, with no Promise.race. If execution was stuck somewhere that ignored the abort signal (a hung request, a dead stream), the await never ended. Only the 20-minute watchdog actually worked. "Killed after 20 minutes" wasn't a threshold set too high — the short timeout never took effect.
4. Kill decisions looked only at wall clock, not progress. The timeout check was "now minus start". Tool-call counts were only interpolated into a message, never used in the decision. The other guardrail tripped on more than 200K output tokens — the opposite direction, catching "too much output", never firing for a stuck agent with zero output. Every activity was timestamped, but nothing consumed it.
5. Model requests could hang forever. The stall monitor only logged — and after a few warnings it stopped logging. No abort, no retry, no escalation. No first-token timeout or idle timeout on the request path. The zero-tool sub-agent never even got its first token.
6. A global cap of 5, with foreground agents counting. Not per session; synchronous foreground sub-agents registered and counted too. Five runs shared one upstream and slowed each other down, turning cause 1's duplicate dispatches into an avalanche.
7. A killed sub-agent's output was thrown away entirely. Text already streamed was discarded on abort; the call that marked failure returned early because the status was already "aborted"; the main agent's completion notice carried the timeout message as its summary. Tokens burned, nothing recovered.
8. The tool description encouraged dispatching and never constrained it. Its first line was "send several in one message to run in parallel", with not a word about when not to. So work the main flow could finish in two minutes, like "fill in intimacy validation", got dispatched and took a dozen extra minutes. Claude Code's equivalent tool explicitly says "don't delegate a single lookup in a known file". Separately, the model parameter's description said "e.g. use a cheaper model for simple tasks", and the model itself downgraded the sub-agent a full generation.
What we fixed that day
| Change | Status |
|---|---|
Sub-agent execution uses Promise.race, with a hard 30-second backstop after a soft abort | Fixed |
| The background reply became an actionable instruction: "do not re-dispatch" | Fixed |
| Dispatches identical after normalization (description or prompt) in the same session are blocked | Fixed |
| The tool description got a "when not to dispatch" bar | Fixed |
| Zero-progress early stop: abort after 3 minutes with 0 tools and 0 output tokens | Fixed |
| Model downgrades only within the same generation | Fixed |
| Callbacks use the renamed ID | Fixed |
| Concurrency cap 5 → 3 | Fixed |
| First-token timeout + retry | Not done — the real root of cause 5; zero-progress stop only shrinks the symptom from 20 minutes to 3 |
| Record "last progress time" for idle detection | Not done |
| The stall monitor actually aborting or escalating past a threshold | Not done |
A few trade-offs:
- Dedup is deliberately conservative: only exact matches after normalization are blocked. Fuzzy matching would treat "edit views" and "edit routes" as duplicates and kill partitioned parallelism. The cost: the pair in this incident ("pet growth refactor" vs "carry out growth refactor") was worded differently and wouldn't be caught — that kind is handled by "do not re-dispatch" in the reply.
- Zero progress means the strongest signal only: 0 tools and 0 output tokens. One emitted token and it doesn't count, to avoid killing legitimate long thinking. The cost: "did a little, then stuck" isn't caught.
- Soft abort before the hard backstop: cooperative cancellation can recover partial output; force only if that fails.
What it meant for the benchmark
The desktop runs in that round took 7.9, 14.4 and 16.8 minutes — a wide spread, likely driven mostly by this idling rather than task difficulty. In other words, the time metric included both model ability and system idling.
Conclusion
Starting from the stall log and the dispatch timeline, we traced the idling to eight root causes: a background reply that made the model think nothing was done and re-dispatch, no dedup at three layers, short timeouts that never took effect, wall-clock-only kill decisions, model requests that could hang forever, a globally shared concurrency cap, output discarded on kill, and a tool description that only encouraged dispatching. We fixed eight items that day and left three, including the first-token timeout, for next. When analyzing timing data now, we first take out the part caused by system idling.